- Three deep dives
SEO Case Studies: The Numbers, and What Produced Them
MarketLatch SEO case studies show how specific search, technical and marketing problems were diagnosed, what implementation decisions followed, and which results were actually verified. Each published case study separates measured evidence from interpretation instead of presenting unsupported ranking or traffic claims.
Mobile LCP diagnosed — 13.7× over budget
Of payload in one category of asset
Cost per landing-page view, Meta test
SEO Case Studies: Results at a Glance
These selected case studies summarize the problem, implementation and verified evidence before the full evidence and methodology below.
Technical Performance
Problem: 34.3-second mobile LCP
Diagnosis: Core Web Vitals and page-weight investigation; 85–88% of the payload sat in one asset category.
Action: A sequenced Critical / High / Medium / Low remediation roadmap was produced.
Measured result: No verified post-implementation result yet; remediation had not been independently re-measured.
Method: PageSpeed Insights + Lighthouse 13.4.0; desktop unthrottled and mobile Moto G Power / Slow 4G.
Elementor / WordPress Performance
Problem: A complete website needed to be built from scratch without sacrificing mobile usability or performance.
Diagnosis: Elementor’s markup and asset overhead was treated as a design constraint rather than a post-launch cleanup task.
Action: Flexbox containers, limited nesting, a deliberately small widget set, constrained images and configured caching were used.
Result: Complete WordPress website design and build with performance considered throughout the build.
Method: Elementor + Astra + LiteSpeed + Rank Math, with responsive layouts designed across breakpoints.
Meta Ads Campaign Testing
Problem: Validate Meta campaign performance with a deliberately capped budget.
Diagnosis: Three campaigns tested different objectives, creative approaches and audience execution.
Action: Campaigns were run and measured using data directly from Meta Ads Manager.
Measured result: PKR 2.13 landing-page view cost.
Method: Meta Ads Manager campaign data across three completed campaigns.
Verified SEO Case Studies With Real Numbers
Every Market Latch engagement is delivered by a named specialist with a documented skill set — not an anonymous resource pool. Here is exactly who does what.
📌 Note: Market Latch publishes only verified, permission-granted case studies. As new client engagements complete, results are documented here. In the meantime, see the case study structure below — this is exactly how every SEO results case study will be reported.
Record a baseline before touching anything
Rankings, Core Web Vitals on desktop and throttled mobile, indexation, local visibility, existing conversion tracking. Without a starting number every later improvement claim is unfalsifiable — and unfalsifiable claims are how agencies get away with doing very little.
Measure with named, reproducible tools
PageSpeed Insights and Lighthouse, Google Search Console, the official Schema.org validator, SEOquake, Semrush and Ahrefs, GA4. Every finding names its source so you can reproduce it independently.
Separate cause from symptom
A poor performance score is a symptom. The cause might be image weight, render-blocking CSS, excess JavaScript or slow server response — and the fix differs completely in each case. Chasing the score instead of the cause produces expensive activity and no improvement.
Rank by impact over effort
Critical / High / Medium / Low, with quick wins isolated so work can start immediately rather than waiting on a development sprint. Nobody has an infinite budget; the sequencing is the deliverable.
Implement in an order that keeps effects attributable
Batch everything into one release and the result is a single before-and-after with no way to tell which change earned it. Sequencing preserves the signal, and the signal is what tells you where the next budget should go.
Re-measure under identical conditions
The same throttling profile, the same device emulation, the same time of day. Change the test conditions and you have measured your methodology, not your website.
On ROI, honestly. Return on investment is only calculable when the inputs are tracked: conversion tracking live before launch, a known lead or order value, and an agreed attribution window. Where a client has those, we report ROI. Where they do not — which is most small businesses at the start — the honest deliverable is cost per measurable result plus the tracking infrastructure to compute ROI later. Both situations appear below.
Case 01 — Technical SEO Case Study: Fixing Core Web Vitals
A 29 MB page and a 34-second load
Qadeem Crafts · handmade carpets, kilims and gemstones shipped worldwide from Hunza · audited 1 July 2026
Core Web Vitals
Schema
E-commerce
Next.js
Lighthouse 13.4.0
Background
Qadeem Crafts sells handmade carpets, kilims, pashmina shawls and natural gemstones to buyers in the United States, United Kingdom and Japan. The storefront is a bespoke Next.js application on Material UI, with product imagery served from Amazon S3 through CloudFront — several hundred products, an active blog, and a genuine five-star video testimonial carousel.
The brief was simple: the site looks good and does not perform in search. The job was to establish whether that was a content problem, an authority problem, or a technical one.
Why the platform shaped the diagnosis
Because this is a custom React application rather than WordPress or Shopify, a standard CMS checklist would have been close to useless. The audit had to reason about framework-specific behaviour — how Next.js handles image optimization, where its rendering boundaries sit, how assets are served from an external CDN bucket. That distinction turned out to be the entire story.
What the measurements showed
Captured 1 July 2026 via PageSpeed Insights, Lighthouse 13.4.0. Desktop unthrottled; mobile on an emulated Moto G Power under Slow 4G — deliberately, because that approximates a real shopper on an average phone and connection, not a developer on office fibre.
As demonstrated in this Core Web Vitals case study, a 34.3-second Largest Contentful Paint is not a marginal problem. It is nearly fourteen times Google’s threshold, and in practice it means a shopper on a phone stares at an effectively blank page for over half a minute. Almost nobody waits.
That last bar is the one worth pausing on. A Cumulative Layout Shift of exactly zero tells you the developers were competent — element dimensions were properly reserved and nothing jumped during load. This was not a badly built site. It was a well-built site with one systematically applied oversight, which is a completely different and far cheaper problem to solve.
| Metric | Desktop | Mobile | Google “good” |
|---|---|---|---|
| Performance score | 56 / 100 | 52 / 100 | 90+ |
| First Contentful Paint | 0.7s | 2.7s | ≤ 1.8s |
| Largest Contentful Paint | 3.8s | 34.3s | ≤ 2.5s |
| Total Blocking Time | 340ms | 390ms | ≤ 200ms |
| Cumulative Layout Shift | 0 | 0 | ≤ 0.1 |
| Speed Index | 3.8s | 17.4s | ≤ 3.4s |
| Total payload | ~22 MB | ~29 MB | < 2 MB |
| SEO (Lighthouse) | 92 / 100 | 92 / 100 | 90+ |
| Accessibility | 85 / 100 | 80 / 100 | 90+ |
| Agentic Browsing (experimental) | 1 / 3 | 1 / 3 | 3 / 3 |
The bottlenecks
- Uncompressed images — the dominant cause. PageSpeed identified roughly 19.3 MB desktop and 25.4 MB mobile of recoverable savings from image delivery alone. That is 85–88% of the entire payload sitting in files that did not need to be that size.
- An inconsistently applied pattern. Source review showed the hero banner and category tiles correctly using Next.js’s image optimizer with responsive srcset. The three product carousels — New Arrival, Most Sold, Featured — bypassed it entirely, pulling raw full-resolution PNGs straight from S3. Several were multi-megabyte files displayed a few hundred pixels wide.
- Render-blocking fonts. An external Google Fonts stylesheet loaded as a blocking link, costing 160ms desktop and up to 1,610ms mobile before rendering could begin — despite the codebase already using next/font elsewhere.
- Excess preconnect hints. More than four declared (CloudFront, S3, Google Fonts ×2). Preconnect is a scarce resource; over-declaring slows connection setup rather than accelerating it.
- Unused and legacy JavaScript. Roughly 1.2 MB unused, plus legacy transpiled code shipped to modern browsers — a browserslist target misconfiguration common in Next.js projects. Main-thread work ran 3.2s desktop, 3.6s mobile.
- Missing commercial schema. Organization and WebSite markup validated at zero errors and zero warnings. But no Product, Review, BreadcrumbList or FAQPage markup existed on a store with hundreds of priced, in-stock items and real testimonials — forfeiting price and star-rating rich snippets entirely.
- Diluted crawlable text. A 3.36% text-to-HTML ratio against SEOquake’s 15% problem threshold, with interface boilerplate and raw currency strings outranking descriptive terms like “hand-knotted” in keyword density — plus evidence of a currency mismatch between what Googlebot received and what shoppers saw.
- Duplicate product descriptions. Several near-identical descriptions reused across different products, creating thin-content risk at scale.
- No off-page authority. Live backlink and referring-domain counts both zero, with 26 historical referring domains on record.
The roadmap delivered
Sequenced so the highest-leverage work came first and results stayed attributable.
Compress and convert every image — Critical
All product, category and blog imagery through automated compression, converted to WebP or AVIF with responsive sizes. The single highest return available anywhere on the site.
Route carousels through the existing optimizer — Critical
Apply the same Next.js Image component already working on the hero and category tiles. The pattern was already proven in the codebase; it needed extending, not inventing. This is what turns "rebuild your image pipeline" into a far cheaper conversation with a dev team.
Lazy-load below-the-fold assets — Critical
Including the YouTube testimonial iframe, which loads a substantial player bundle whether or not anyone scrolls to it.
Set long-lived cache headers — High
Cache-Control on static assets from CloudFront and S3. Around 18.5 MB desktop and 25.7 MB mobile identified from cache lifetimes alone.
Remove render-blocking fonts — High
Migrate to next/font, already partially in use, and preload only the weights actually rendered.
Implement Product and Review schema — High
Price, currency and availability on product pages; Review markup on genuine testimonials; BreadcrumbList across the hierarchy. Modest effort, high visibility return.
Fix duplicate descriptions and the title tag — Medium
Rewrite reused copy; cut the 93-character homepage title to under 60–70.
Verify crawler currency — Medium
Confirm which currency Googlebot receives, since SEOquake captured PKR strings against USD pricing shown to shoppers.
Trim JavaScript, correct the build target — Medium
Audit unused bundles; stop shipping legacy polyfills to modern browsers.
Build genuine off-page authority — Long-term
Outreach to home-decor publications, marketplace cross-linking, guest content. The only item here that cannot be shipped in a sprint.
Overall SEO score at audit
Report sections delivered
Identified mobile savings
Sequenced implementation plan
Why there are no “after” numbers here. The engagement scope was a diagnostic audit. Implementation sits with the client’s development team, and at the time of writing remediation has not been completed and independently re-measured. Publishing projected improvements as though they had been achieved is exactly the practice this page exists to argue against. The audit’s own assessment was that clearing the Critical and High items would be expected to lift Performance and Mobile substantially and move the overall score from Fair into Good within 30–60 days — an expectation, labelled as one. Verified figures will replace this note once re-testing is done and the client approves publication.
What generalises beyond this client
Two things. First, catastrophic performance problems usually have one dominant cause rather than fifty small ones — here 85–88% of the payload sat in a single category of asset, which means the fix list is far shorter than the symptom list suggests. Second, finding the correct pattern already working elsewhere in the same codebase is the most valuable thing an audit can produce, because it collapses a rebuild into an extension.
For broader technical and search support, see our professional SEO services.
Case 02 — WordPress design & user experience
Building fast on a page builder
Delta’s Design · complete website design and build from scratch
Elementor
Astra
Responsive
LiteSpeed
Rank Math
Objectives
Delta’s Design needed a complete website built from scratch. Three stated requirements shaped it: genuinely professional rather than templated, properly functional on mobile rather than merely fitting on a phone screen, and fast enough that real visitors on average connections did not abandon before the page rendered.
A fourth requirement went unstated but decided everything — the client needed to edit it afterwards without hiring a developer. That single constraint eliminated a hand-coded static build, and it is why this site runs on WordPress and Elementor despite the performance cost that choice carries.
The brief was simple: the site looks good and does not perform in search. The job was to establish whether that was a content problem, an authority problem, or a technical one.
The central tension
Page builders trade markup weight for editability. Elementor generates more DOM nodes and loads more CSS than hand-written HTML would, and no amount of optimization fully closes that gap. Pretending otherwise is how builder sites end up scoring 40 on mobile.
So the performance budget was treated as a design constraint — agreed at wireframe stage, enforced during build — rather than a cleanup task scheduled for after launch, which is a task that historically never happens.
Workflow
Conversion path mapped before layout
What a visitor needs to understand, in what order, and where the enquiry action sits. Structure first, styling second — reversing that is how sites end up beautiful and inert.
Flexbox containers throughout
Elementor's flexbox system rather than the legacy section-and-column model. Measurably lighter output and far more predictable across breakpoints, which reduces the volume of responsive patch CSS needed later.
Nesting capped at two levels
Deep nesting is the primary source of DOM bloat in builder sites. Anything needing a third level was treated as a signal the layout itself needed simplifying.
Widget set kept deliberately small
Every additional widget type loads its own CSS and often its own JavaScript. A small repeated set keeps the asset footprint flat as page count grows.
Images constrained at upload
Dimensions capped to actual display size, modern formats where supported, lazy loading below the fold. The highest-leverage habit in WordPress performance and the most commonly skipped.
Responsive states designed, not derived
Mobile, tablet and desktop styled as deliberate layouts — including touch target sizing and tap spacing, which Lighthouse flags routinely on builder sites and which materially affects mobile conversion.
Caching configured, not defaulted
LiteSpeed set up with page caching, CSS and JS optimization and sensible cache lifetimes — rather than activated and left at factory settings, which is the norm and the reason most caching plugins achieve nothing.
On-page SEO completed before launch
One H1, sequentially descending headings, descriptive alt text, meaningful internal anchor text, and Rank Math title and description fields written for every page. Not a later "SEO phase" — that phase usually never arrives.
Trade-offs accepted
- Builder overhead for client autonomy. A static build would be lighter and would also make the client dependent on a developer for every text change. For a small business that is the worse outcome.
- Visual restraint over maximalism. Heavy animation, video backgrounds and parallax all cost render time. Presence comes from typography, spacing and hierarchy instead — cheaper to load and, we would argue, better looking.
- Fewer plugins over more features. Each one adds attack surface, update burden and usually front-end assets. Anything the theme or a small snippet could handle, it handled.
What generalises
Performance on a WordPress build is decided at wireframe stage, not at launch. Nearly every slow builder site we audit got that way through accumulated small permissions — one more widget, one more plugin, one more full-width video — each individually defensible. A budget agreed before design starts and enforced during build costs nothing and prevents the whole problem. Retrofitting speed onto a finished Elementor site is one of the most expensive jobs in WordPress.
Case 03 — Meta Ads Case Study: Analyzing Three Campaigns and One Useful Failure
Three campaigns and one useful failure
Meta Ads · PKR 2,389.72 total measured spend across three completed campaigns
Meta Business Suite
Custom audiences
Advantage+
Canva
Setup and objectives
Three completed campaigns run from the Market Latch page, each testing a different objective and creative approach against a deliberately capped budget. Figures come directly from Meta Ads Manager.
Stating the obvious first: PKR 2,389.72 is a learning budget, not a media budget. These tests existed to validate creative direction, audience response and cost-per-result mechanics before committing real money — which is what a small business should do, and what agencies routinely skip because a large budget is easier to bill against.
A fourth requirement went unstated but decided everything — the client needed to edit it afterwards without hiring a developer. That single constraint eliminated a hand-coded static build, and it is why this site runs on WordPress and Elementor despite the performance cost that choice carries.
The brief was simple: the site looks good and does not perform in search. The job was to establish whether that was a content problem, an authority problem, or a technical one.
Total spend, 3 campaigns
Total impressions
People reached
Workflow
| Campaign | Objective | Spend | Impr. | Reach | Freq. | CPM | Result | Cost / result |
|---|---|---|---|---|---|---|---|---|
| Page growth Nov 23 | Page visits | 410.81 | 5,291 | 4,615 | 1.15 | 77.64 | 196 visits | 2.10 |
| GBP services Feb 20 | Website visitors | 900.00 | 24,233 | 16,719 | 1.45 | 37.14 | Not tracked | — |
| Budget calculator Jun 22 | Website visitors | 1,078.91 | 13,948 | 11,559 | 1.21 | 77.35 | 507 LPV | 2.13 |
All currency PKR. LPV = landing page views. Figures as reported in Meta Ads Manager.
Unedited screenshots of the three completed campaigns — every number in this Meta ads case study traces directly back to these.
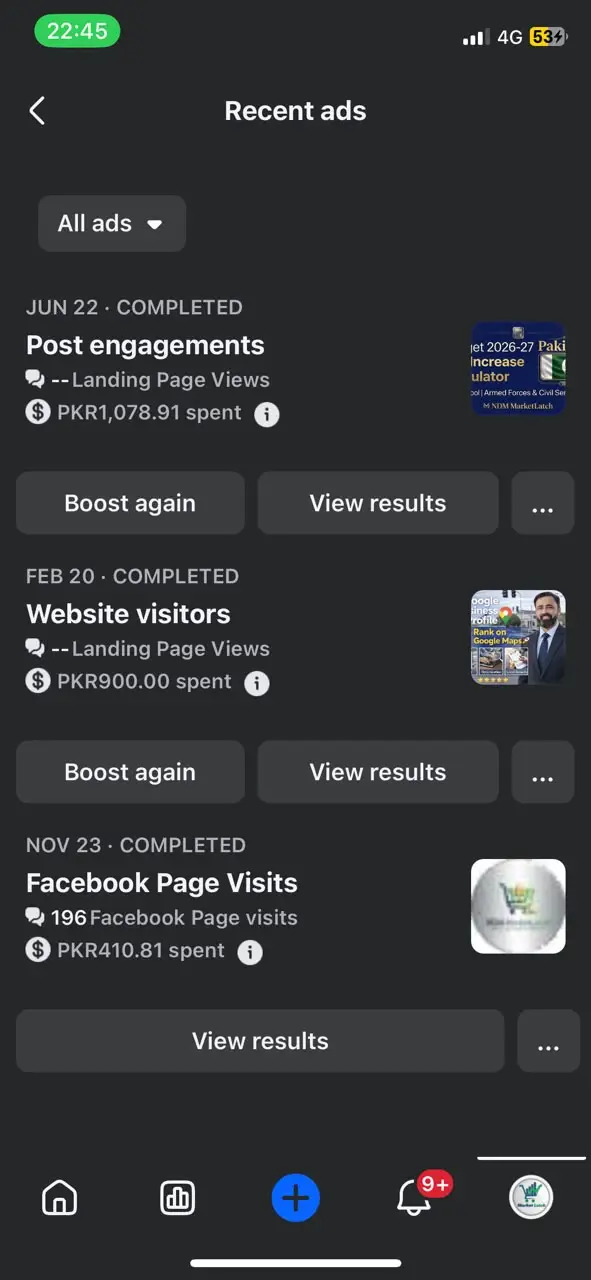
All ads · overview
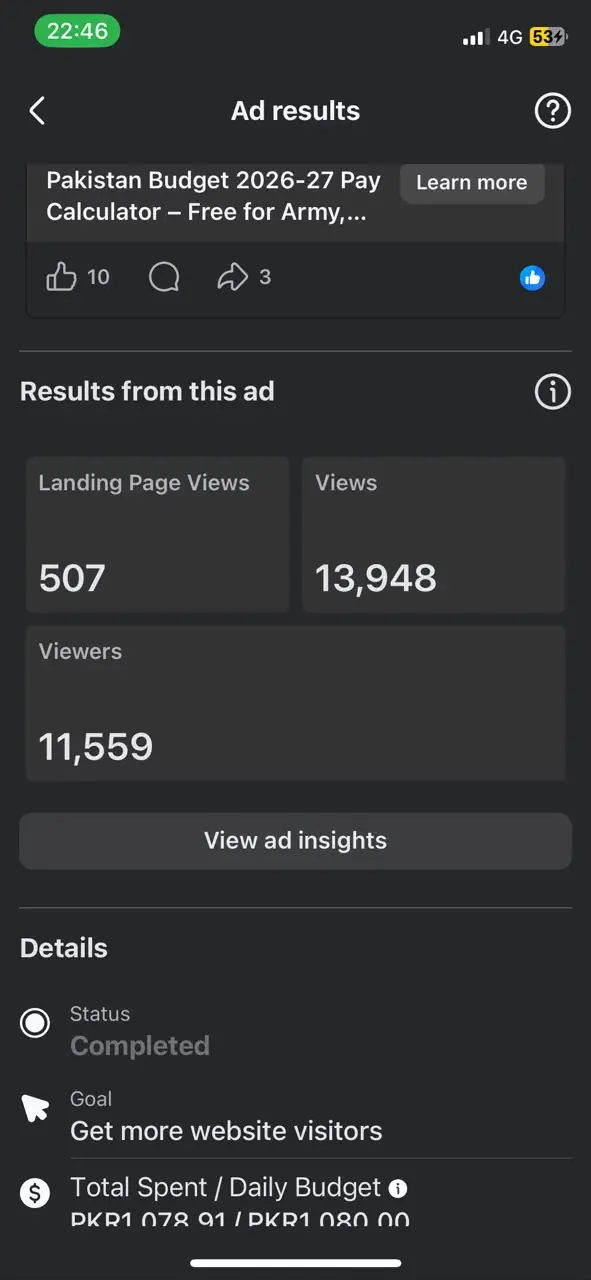
Budget calculator · 507 LPV
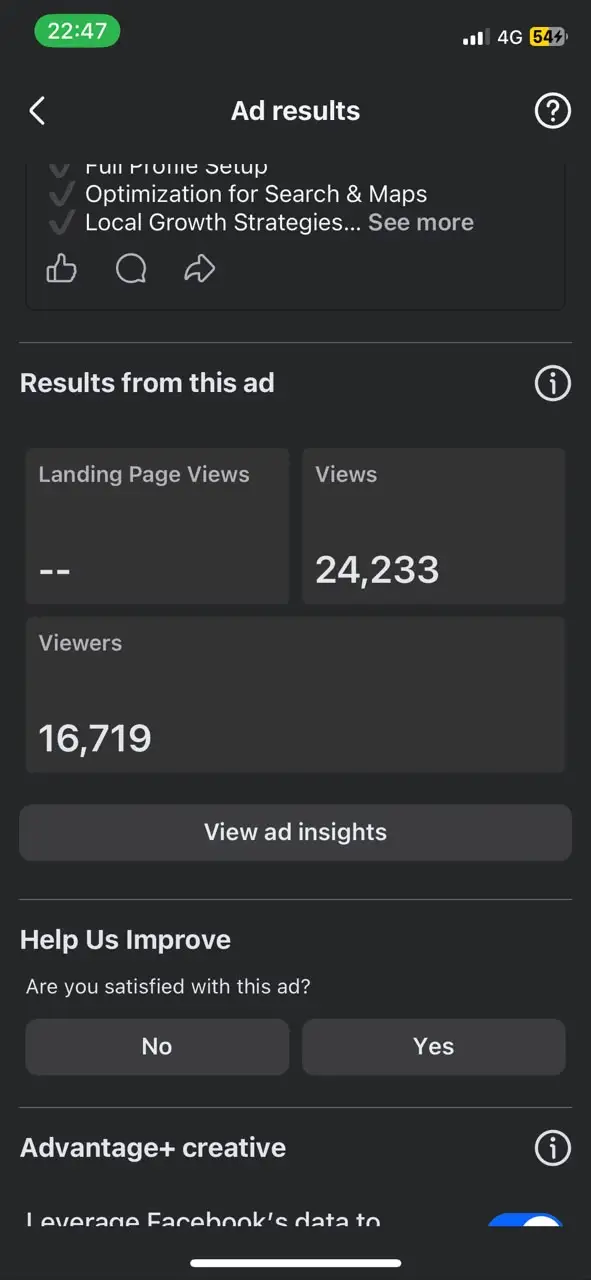
GBP services · 24,233 views
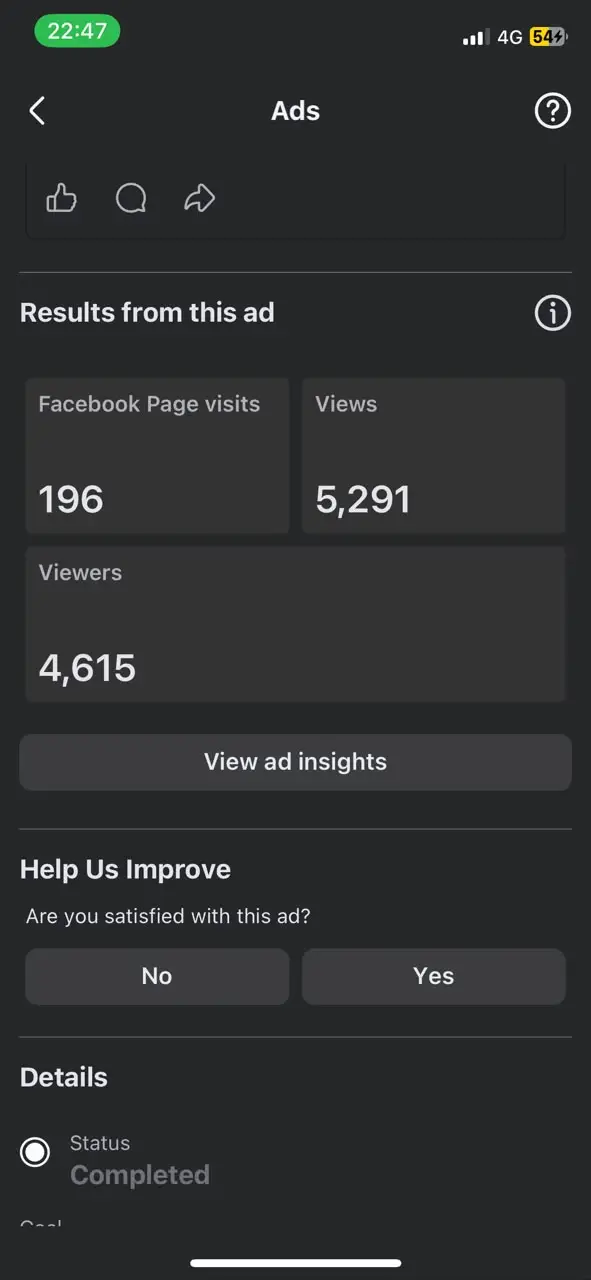
Page growth · 196 visits
Creative and audience execution
- Creative produced in Canva against a locked brand kit. Fixed palette, typography and logo placement, so output stays consistent across campaigns and remains reproducible by the client’s own team afterwards.
- Value-stack creative on the service ad. The GBP campaign led with an explicit checklist — full profile setup, optimization for Search and Maps, local growth strategies — rather than a generic “we do local SEO” claim. Specificity is what makes a cold audience stop scrolling.
- Advantage+ tested on one campaign only. Enabled on the GBP campaign so its effect on delivery could be isolated rather than confounded across all three.
- Frequency watched as a waste signal. All three held between 1.15 and 1.45, meaning budget went to reaching new people rather than re-showing one ad to a saturated pool — the correct profile for cold acquisition.
- Offer-led targeting on the calculator. Audience defined by occupation and matched to a genuinely useful free tool rather than a service pitch.
Results, and what they mean
Consistent cost per result across two different objectives
PKR 2.10 per Facebook page visit and PKR 2.13 per landing page view — remarkably close across campaigns run months apart with different creative and different goals. That consistency suggests the underlying targeting and creative quality were sound, since cost per result diverges sharply when either is badly calibrated.
The campaign that delivered best and proved nothing
At PKR 37.14 CPM the GBP campaign delivered impressions at roughly half the cost of the other two and reached 16,719 people — more than the other campaigns combined. By delivery efficiency it was clearly the strongest of the set.
Its Landing Page Views field reads "Not tracked".
The objective was website visitors; landing page view tracking was never correctly configured; the actual result was therefore never recorded. The most efficient campaign in the set produced no attributable outcome data whatsoever.
What this changed, permanently. Every campaign Market Latch now runs for a client has tracking verified before launch: Meta Pixel firing and confirmed in Events Manager, conversion events mapped to real business actions, GA4 receiving traffic correctly, and the campaign objective matching the metric being optimized toward. A campaign you cannot measure is one you cannot improve — and, more importantly, one you cannot honestly report on. We publish this because a case-studies page showing only wins tells you nothing about how your money gets handled when something goes wrong.
Why the offer beat the targeting
507 landing page views from 13,948 impressions is a 3.6% landing-page-view rate against impressions — strong for cold traffic — plus 10 reactions and 3 shares of organic engagement, which paid service ads very rarely earn.
The transferable insight is about offer design, not media buying. A free Pakistan Budget 2026-27 pay calculator aimed at a defined occupational audience asks for attention in exchange for immediate, concrete value. A service advertisement to the same people asks them to consider a purchase. The first is a far smaller request, converts cold traffic substantially better, and leaves behind a retargetable audience with demonstrated relevant interest.
Scaling strategy, and its limits
- Fix measurement before raising spend. Scaling an unmeasured campaign multiplies uncertainty, not results.
- Build retargeting from traffic already earned. The calculator campaign produced a warm audience who took a relevant action. Retargeting them with a service offer is materially cheaper than buying new cold traffic.
- Scale in increments, watch frequency. Rising frequency alongside rising cost per result is the signal that an audience is saturating and needs expanding or refreshing.
- Expect cost per result to rise. It nearly always does as spend grows and the most responsive segment is exhausted.
What this case study does not contain. No return on ad spend, no cost per acquisition, no revenue attribution. No purchase or lead conversion tracking was configured on these tests, so those figures do not exist and are not estimated here. Extrapolating PKR 2.13 to a large budget would be dishonest, so we do not do it. If an agency quotes you a ROAS without showing the tracked conversion event behind it, ask to see the Events Manager screenshot.
The AI & technical SEO playbook
How search engines evaluate a modern site, and what changed once generative engines joined the pipeline. This framework forms the foundation for every technical SEO case study and audit we perform.
1. Crawl, render, index, rank — and now, cite
The classical pipeline has four stages. A crawler discovers a URL; a renderer executes its JavaScript and builds the DOM; an indexer stores the result; a ranker orders it against a query. Failure at any stage makes every later stage irrelevant — which is why a site can have excellent content and no visibility whatsoever.
A fifth stage now sits alongside these. Generative engines and AI Overviews synthesise answers by extracting and attributing passages from indexed documents. Being ranked and being cited are related but distinct, and the second increasingly decides whether anyone reaches your site at all.
The practical consequence: content structured as a direct answer to a specific question, near the top of a well-formed heading hierarchy, is extractable. The same information buried mid-article behind 600 words of preamble is not.
2. Core Web Vitals as diagnostics, not doctrine
LCP, INP and CLS matter as ranking inputs, but their weight is frequently overstated relative to relevance and authority. Their real value is diagnostic.
A 34-second LCP does not primarily hurt because Google penalises it. It hurts because nobody waits 34 seconds. The ranking signal and the commercial signal point the same way, which is why performance work is worth doing regardless of algorithmic weighting — you optimize for the human and the algorithm happens to agree.
Worth understanding: lab and field data are different things. Lighthouse produces lab data under simulated conditions and swings between runs. The Chrome User Experience Report produces field data from real visitors, which is what Google actually uses. A new or low-traffic site has no field data — Qadeem Crafts’ INP showed “no data” for exactly this reason — so lab measurements are the only available proxy and should be read as directional.
3. Structured data is a translation layer
Schema does not make a page rank better in any direct sense. It makes a page legible — converting prose a machine must infer meaning from into explicit statements it can parse: this is a product, this is its price, this is its availability, this is a review and this is its rating.
That legibility pays twice. Rich results — stars, prices, FAQ dropdowns — lift click-through from the same ranking position. And entity clarity helps both classical and generative systems understand what your business is, which matters more as AI systems assemble answers preferentially from structured sources.
The common failure is not absence but incompleteness. Qadeem Crafts had valid Organization and WebSite schema — more than most small stores manage — and no Product, Review or BreadcrumbList markup at all. The foundation was right; the commercially valuable layer was simply missing.
4. E-E-A-T is an evidence problem, not a writing style
- Experience shows in specifics only a practitioner would know — that image optimization was applied to hero banners but not carousels; that a campaign’s result field was blank because tracking was misconfigured. Generic advice signals nothing.
- Expertise shows in named, verifiable credentials attached to a named author, and in correct reasoning about edge cases.
- Authoritativeness is largely external — who cites you, who links to you. It is the slowest of the four and cannot be shortcut, which is why zero live backlinks was flagged as long-term rather than a quick win.
- Trustworthiness is structural: real contact details, transparent policies, honest claims, and publishing the things that did not work. A page of unbroken success is a weaker trust signal than one containing a clearly explained failure.
5. One page, one intent
The most consequential architectural decision a multi-service business makes is whether each service gets its own URL. Combining them dilutes topical relevance across every service simultaneously and gives search engines no clear target for any of them.
The corollary is internal linking. Links move relevance and authority between pages, and descriptive anchor text carries the meaning with them. “Technical SEO audit” tells a search engine what sits at the destination; “click here” tells it nothing. Close to free to get right, quietly expensive to get wrong at scale.
6. Preparing for AI-agent discovery
PageSpeed now includes an experimental Agentic Browsing category — Qadeem Crafts passed 1 of 3 checks, flagged for a malformed accessibility tree and no llms.txt. Both are emerging conventions rather than established ranking factors and should be treated as such.
The underlying principle holds regardless of how those conventions evolve: a well-formed accessibility tree, semantic HTML and clean heading hierarchy make a page comprehensible to screen readers, crawlers and AI agents alike. The same fixes serving three audiences at once — worth doing on cost grounds even if the AI-specific signals never mature.
The uncomfortable prerequisite. None of the above matters if a site is blocked from indexing. Before optimizing anything, check that WordPress Settings → Reading does not have “Discourage search engines” enabled, that robots.txt permits crawling, and that no page-level noindex is present. It is the single most common catastrophic SEO error, it produces zero visibility regardless of content quality, and it takes ten seconds to verify.
What people ask after reading these
Crawling and re-indexing of changed pages typically happens within days to a few weeks depending on crawl frequency. Ranking movement is slower and less predictable — usually four to twelve weeks for competitive terms, and dependent on what else changed in the index meanwhile. Performance fixes are the exception: improved load speed benefits real users immediately, on the day it ships, whatever the search engines decide afterwards.
Because it is the most useful thing on this page. The GBP campaign delivered the best cost per thousand impressions of the three and produced no measurable outcome, because tracking was not configured before launch. That single failure permanently changed our standard operating procedure. A prospective client learns far more about how we work from that than from three tidy successes — and a portfolio containing no failures is either very short or not entirely honest.
We guarantee correct diagnosis and a prioritised roadmap. Whether the site then passes depends partly on things outside our control — hosting quality, third-party scripts you need for business reasons, platform constraints, and how much of the roadmap actually gets implemented. What we can say confidently is that where the dominant cause is image weight, as it was at 85–88% of payload above, the improvement from fixing it is large and predictable.
Impact divided by effort, with one override: anything blocking indexing or breaking measurement jumps the queue regardless of effort, because everything downstream of it is wasted until it is fixed. After that, findings sort into Critical, High, Medium and Low with a quick-wins set isolated so work can begin immediately. The Qadeem Crafts roadmap put image compression first because it addressed roughly 85% of the page payload — no other single fix came close.
Yes, if you treat it as research rather than acquisition. A small budget validates creative direction, audience response and cost-per-result mechanics before you commit real money — exactly what the three campaigns above did. What it cannot do is produce reliable conversion volume or a trustworthy ROAS figure, because the sample is too small. The mistake is not spending small; it is spending small and drawing conclusions as though you had spent large.
Nothing, and it is never required. Publication is always opt-in, never a condition of engagement, and never a discount lever. Where a client prefers their strategy stays private — entirely reasonable in a competitive market — the work simply does not appear here.
Both. Every audit report names the tool behind each finding and includes the underlying measurements, so you can re-run them yourself and get the same numbers. Screenshots of Lighthouse output, validator results and Search Console exports are included rather than summarised away. This matters more than it sounds: a report you cannot verify is a report you have to take on faith — and the whole point of a diagnostic is that it removes faith from the equation.
Find out what is actually holding your site back
Send your URL and the outcome you are chasing. You will get a written reply naming the three highest-impact issues visible from the outside, each with the tool that identified it — free, no obligation, no sales sequence attached.
To review more of our design and development work, feel free to SEO and WordPress portfolio